Bulletin – March 2019 Australian Economy The Labour and Capital Shares of Income in Australia
- Download 558KB

Abstract
In Australia, the share of total income paid to workers in wages and salaries (the ‘labour share’) rose over the 1960s and 1970s but has gradually declined since then. The corollary is that the share of income going to capital owners in profits (the ‘capital share’) has risen. The long-run increase in the capital share largely reflects higher returns accruing to owners of housing (primarily rents imputed to home owners, particularly before the 1990s) and financial institutions (since financial deregulation in the 1980s). Estimates of the capital share of the financial sector are affected by measurement issues, though structural factors, such as a high rate of investment in information technology, have reduced employment and increased capital in the sector.
In the 20th century, economists typically assumed that the division of aggregate income between labour and capital (the ‘factor shares’) was stable over a long period of time (Kaldor 1957). This presumption was typically built into models of long-run growth. But since the 1970s, trends in the labour and capital shares of income in many countries have challenged this view and reignited interest in studying the causes of changes in the factor shares (Ellis and Smith 2010, Piketty and Zucman 2014, Elsby, Hobijn and Sahin 2013, Neiman and Karabarbounis 2014).
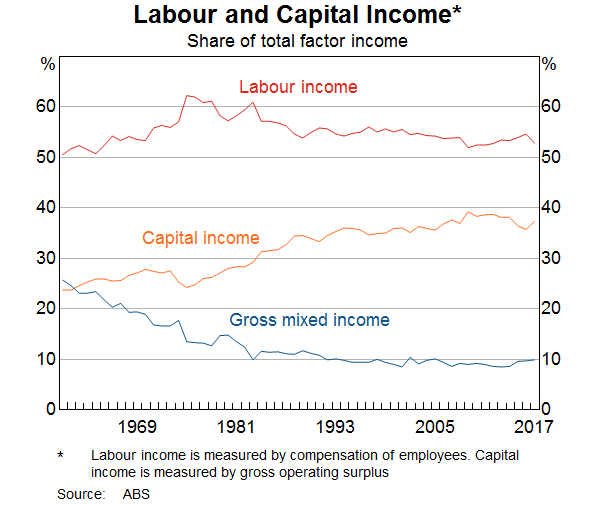
In Australia, the labour share of income – the share of total domestic income paid to workers in wages, salaries and other benefits (‘compensation of employees’) – rose over the 1960s and early 1970s but has gradually declined since then (Graph 1). Since the 1970s there has been a gradual increase in the capital share of income – the share of domestic income going to capital owners in profits (or ‘gross operating surplus’). The income accruing to unincorporated business owners (or ‘gross mixed income’) declined as a share of the economy over the 1960s and 1970s. Gross mixed income reflects a mix of labour and capital income and it is hard to say how much of the profits to business owners is the return to labour and how much is the return to capital. Regardless, it has not been an important driver of the trends in the factor shares since the 1980s (Trott and Vance 2018).[1]
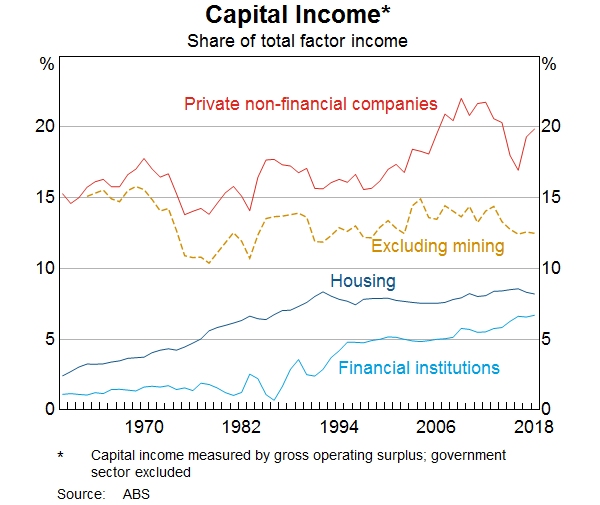
The long-run trend increase in the capital share of income is partly due to an increase in returns accruing to the owners of housing (including both rents paid to landlords and rents imputed to home owners, particularly before the 1990s) (Graph 2). Other advanced economies have seen similar trends towards housing rents accounting for a larger share of the economy (Rognlie 2015, Rognlie 2014, La Cava 2016). The share of income going to capital in the finance sector has also risen strongly since deregulation in the 1980s. However, the long-run trend in the finance sector capital share is affected, at least in part, by issues with measuring financial sector output (to be discussed later). The share of aggregate income going to non-financial companies increased in the 2000s because the resources boom caused mining company profits to rise significantly. Some of the increase in the capital share of income to mining firms has contributed to the overall upward trend over recent decades, given that the terms of trade have remained elevated; however, there was also a temporary boost to mining profits during the boom.
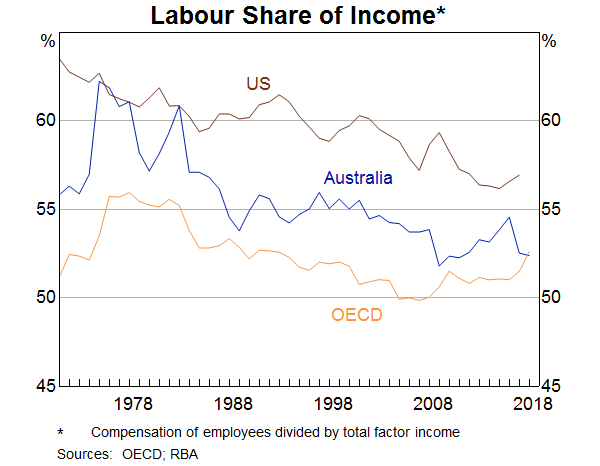
Australia's experience of a falling labour share (and rising capital share) over recent decades appears to be very similar to that of other advanced economies (Graph 3). About 30 advanced economies (accounting for around two-thirds of world GDP) have experienced a decline in the labour share since 1990 (Dao et al 2017).
From the perspective of monetary policy, there are several reasons why understanding the drivers of changes in the labour share might be important.
First, in theory, factor shares can be useful indicators of the state of the business cycle. Profits are more procyclical than labour costs, so a rising capital share is typically indicative of an expansionary phase of the business cycle. If the labour share is declining, this is because real wages growth is not keeping up with labour productivity growth, which implies that businesses face lower cost pressures stemming from the labour market. However, in practice, the RBA's forecasting models find a limited role for the labour share in predicting inflation independent from the business cycle.
Second, longer-term shifts in the labour share can provide insights into changes in the structure of the economy that might be relevant for monetary policy. For example, a change in the composition of capital income towards housing and the financial sector suggests that the economy has become more interest sensitive. Shifts in the labour share could also indicate changes in competitive conditions in markets for labour and goods and services.
This article analyses the changes in the factor shares of income in Australia. It starts by looking at the effects of the mining boom on factor shares, particularly since the peak in the terms of trade in 2012. It then highlights the important role of capital income in the housing and financial sectors for understanding the longer-run trends in factor shares and discusses some leading explanations for these changes, including advances in technology, the globalisation of trade and the rising market power of some large companies.
The Labour Share, Wages Growth and the Resources Boom
The labour share is typically thought of as the ratio of total wages and salaries to total income in the economy. But an alternative way of thinking about it is as the ratio of real wages to labour productivity. Both ratios capture earnings accrued by labour, divided by the value of the output produced by that labour. If the labour share is declining, this is because real wages growth is not keeping up with labour productivity growth.
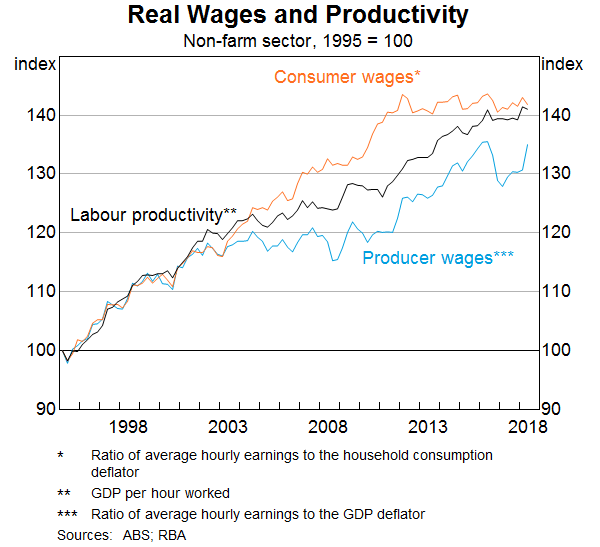
It may be surprising, therefore, that the labour share has shown little net change since the global financial crisis given weak real wages growth and relatively strong productivity growth. The resolution of this puzzle comes from the fact that real wages can be measured in different ways. Real wages are typically measured as the ratio of nominal wages to consumer prices (or ‘consumer wages’). This measures the purchasing power of workers. But real wages can also be measured as the ratio of nominal wages to producer prices (‘producer wages’). This measures the cost of hiring labour from the firm's perspective, and is the measure that underpins the national accounts estimates of the labour share.
Since 2012, consumer wages have grown relatively slowly despite solid growth in labour productivity, which can be partly attributed to the lagged effects of the resources boom on productivity in the mining sector (Graph 4). Much of this productivity dividend has gone to mining companies in profits (and therefore to foreign shareholders to some extent). At the same time, producer wages – which are nominal wages deflated by output prices rather than consumer prices – have increased since 2012 because the decline in the terms of trade has meant that the prices that firms receive have fallen relative to the prices that consumers pay.
Although workers have seen little of the productivity dividend recently, they did benefit from the earlier ‘terms of trade dividend’ (Parham 2013). Strong external demand during the resources boom pushed up producer prices by a lot more than consumer prices. This, in turn, implied that consumer wages grew faster than either productivity or producer wages during this period. Seen over a longer timeframe, the divergence between consumer wages and labour productivity appears to have been a temporary phenomenon and some of the stagnation in consumer wages over recent years is part of the adjustment process to the unwinding of the mining boom. Since 1995, the growth in real consumer wages has basically matched the growth in labour productivity.
Developments in the mining sector and the terms of trade are important for explaining movements in labour and capital shares since 2012, but the housing and financial sectors are more important for explaining the longer-run trends in factor shares to be discussed in the next section.
What Explains the Long-term Trends in the Factor Shares?
The housing sector
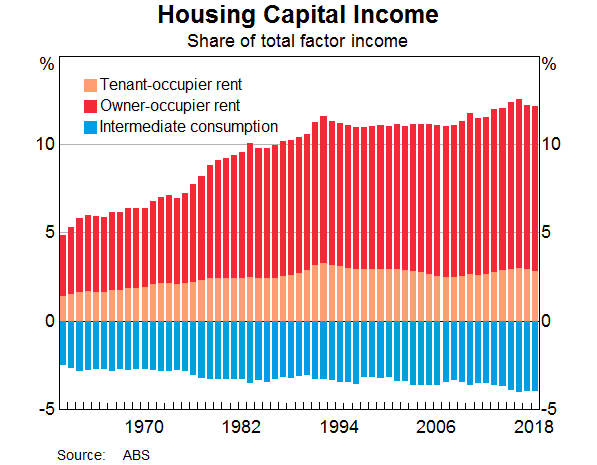
The long-run increase in capital income earned in the housing sector is an important part of the story behind the rise in the aggregate capital share. Housing capital income is measured as total rental income less intermediate consumption of housing. Total rental income includes both the rent earned by landlords from tenant-occupied properties and the imputed rent that is ‘earned’ by homeowners from owner-occupied properties. Intermediate consumption of housing includes maintenance, building insurance, real estate agent commissions and the imputed service charge component of interest paid on mortgages. It is assumed that there is no labour income earned in the housing sector.
As recommended by international guidelines, the Australian national accounts adds an estimate of ‘imputed rent’ for owner-occupiers to both the household consumption and income estimates. This imputed rent measures the value of housing services that owner-occupiers receive from living in an owner-occupied dwelling. The imputed rent component is the largest component of rental income given that most homes are owner-occupied. Conceptually, the inclusion of imputed rent as part of income treats owner-occupiers as if they were renting the home from themselves, so they are both ‘paying’ rent and ‘earning’ rental income. The adjustment makes estimates of consumption and income for renters comparable to owner-occupiers. In imputing rents to home owners, the Australian Bureau of Statistics (ABS) national accounts assumes that rental prices for owner-occupied dwellings move in line with those for tenant-occupied dwellings.
The increase in the housing capital income share since the 1960s is due to a higher share of domestic income being paid in rents, including both higher cash rents paid to landlords and, even more noticeably, higher rents imputed to homeowners (Graph 5).
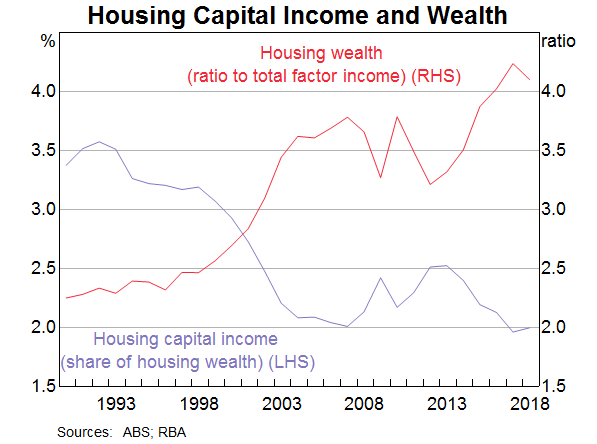
To understand the drivers of the trends in the housing capital share, it can be decomposed into two components: (1) the ratio of housing capital income to the value of land and dwellings (the ‘rate of return on housing’) and (2) the value of land and dwellings to total factor income (the ‘housing wealth to income ratio’). Since at least 1990, the increase in the housing capital share is fully explained by an increase in the housing wealth to income ratio (Graph 6). In contrast, the rate of return on housing has declined over time in line with long-term interest rates.
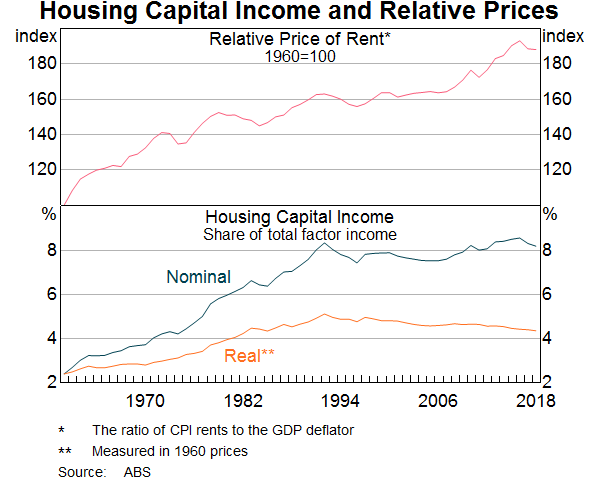
It is also possible to decompose the housing capital share into the relative ‘price’ and ‘quantity’ of housing consumed. About half of the long-run increase in the housing capital share is due to an increase in the relative price of housing. This has been especially important over recent decades (Graph 7). The remainder of the increase in the housing capital share is due to ‘real’ factors, such as an increase in the average size and quality of owned homes. These real factors were particularly important in the period between 1960 and 1990.
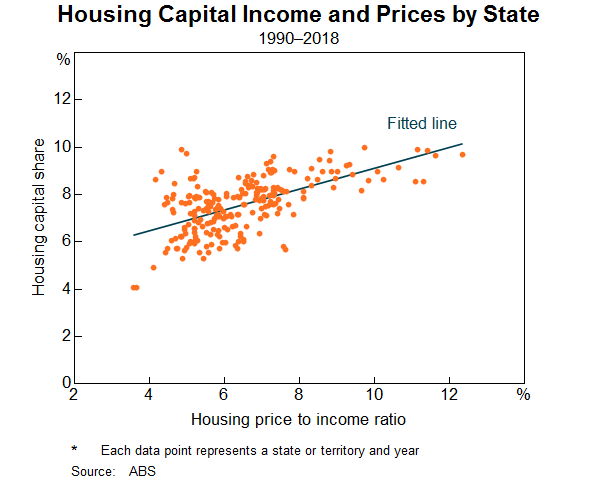
The trends in housing rents, prices and incomes across Australian states can also shed light on the causes of the increase in the housing capital share. Since 1990, the states that have seen the largest increases in housing prices (relative to average household income) have also seen the biggest increases in the housing capital share (Graph 8). This pattern is consistent with factors, such as financial deregulation and disinflation, acting to relax credit constraints and boost demand for owner-occupier housing over recent decades.[2]
The financial sector
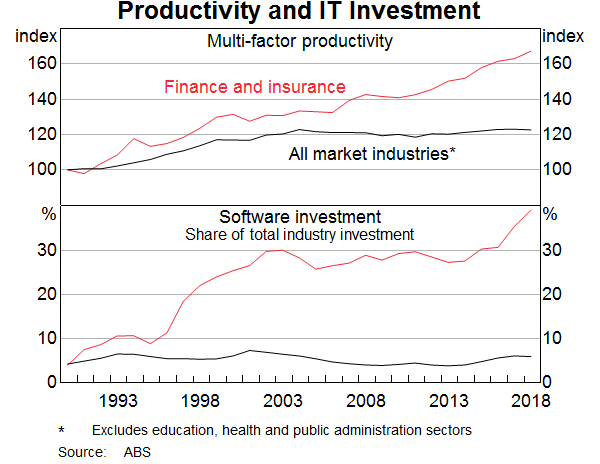
The rise in the share of financial sector capital income, and conversely the decline in the share of labour income, reflects a range of factors. Profits in the financial sector have been boosted by total factor productivity that is estimated to have grown consistently faster than in the rest of the economy (Graph 9, top panel).[3] The fast pace of productivity growth reflects, at least in part, structural changes, such as the relatively high rate of investment in information technology in the sector (Graph 9, bottom panel). Over the late 1990s, there were significant increases in bank efficiency and technological innovation, such as the widespread adoption of ATMs, which resulted in a sharp reduction in the number of bank branches.
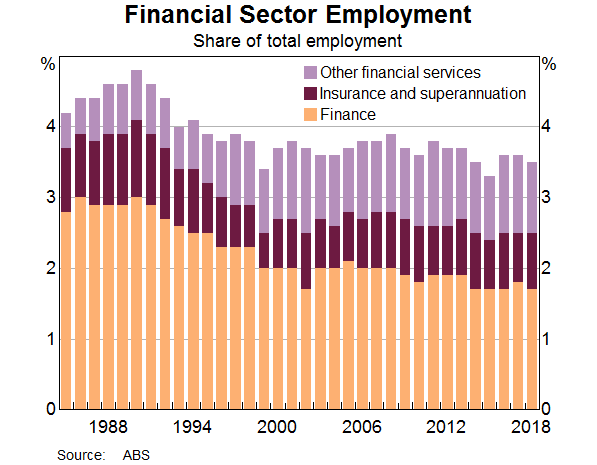
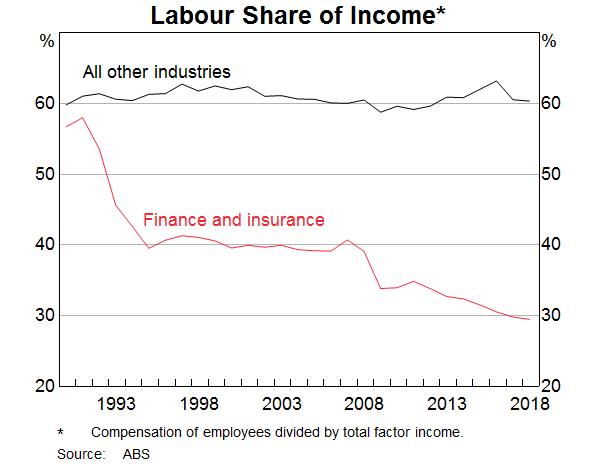
Over this period, there has also been a significant reduction in the number of branch staff, such as bank tellers. There were more people employed in finance in 1990 than there are today (Graph 10), and the share of total industry income going to finance workers has nearly halved since 1990 (ABS 2018) (Graph 11).
The post-global financial crisis decline in the financial sector labour share may also reflect the adjustments made by Australian banks to adapt their business models following the financial crisis. Part of this adjustment has involved a high rate of technology adoption. Over the past decade, job losses in finance has been concentrated in occupations that are exposed to automation, including bank tellers, office support and keyboard operators. At the same time, IT-related occupations, including programmers and IT managers, contributed about one-fifth of total employment growth in the financial sector.
While structural factors matter, the relatively large increase in financial sector output and profits is also due to the way in which financial sector output is measured. It is difficult to measure the output that financial institutions ‘sell’ to households and businesses. The approach in the national accounts (both in Australia and overseas) is to measure financial sector output indirectly through imputed service charges known as financial intermediation services indirectly measured (FISIM).
FISIM is estimated as the spread of the average loan rate (over some reference rate) multiplied by the total stock of loans less the spread of the average deposit rate (over the same reference rate) multiplied by the total stock of deposits. The reference rate is the midpoint between the average interest rate on loans and deposits. For the banks, FISIM is essentially the spread between the interest rate on loans and deposits multiplied by the size of the banks' balance sheets as measured by the stock of loans and deposits.
Because of the way it is measured, a range of factors can affect the output of the financial sector that may not be widely seen to be ‘genuine’ changes in the services provided to households and businesses (Zieschang 2016).[4] A key issue is the way in which the bearing of risk is measured as a service provided by banks (Haldane 2010). For example, an increase in housing prices will be associated with higher demand for mortgage debt and increase the size of bank balance sheets which, in turn, will increase the measured value of financial services. An increase in the spread between the interest rate on loans and deposits can also lead to an increase in the measured value of financial sector output on this basis. Because of this link between interest rate spreads and measured output, the official statistics indicate that financial sector profits grew very strongly through 2008/09 precisely when the global economy was entering a financial crisis (Haldane 2010).
Putting aside some of the challenges associated with measuring financial sector output, an alternative source of information is the publicly listed banks' reported profits. Published annual reports indicate that the banks' profits have risen strongly (relative to GDP) over recent decades and, in fact, by more than that recorded in the national accounts. This suggests that structural factors such as financial sector deregulation and disinflation may have contributed to the rise in the share of financial sector profits, despite also raising competition in the sector (Gizycki and Lowe 2000).[5] Furthermore, statistical analysis indicates that the trend rise in the financial sector's share of corporate profits is strongly correlated with the decline in interest rates over the 1980s and 1990s.
Other sectors
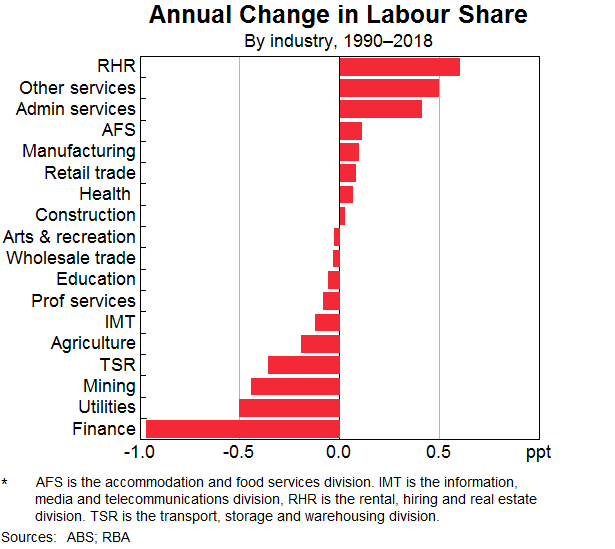
An analysis of the trends in the aggregate labour share may mask important trends occurring at a more granular level within industries. Excluding the financial sector, the aggregate labour share has been unchanged since 1990.[6] Stepping away from the financial sector, the labour share of income has risen in some industries and fallen in others (Graph 12). Industries that have seen the largest increases in the labour share are typically in the services sector and include rental, hiring & real estate services as well as administrative services. Apart from finance, the industries that have experienced the biggest falls in the labour share include utilities, mining and transport. Perhaps surprisingly, the long-run shift in economic activity away from manufacturing and towards services has had little effect on the aggregate labour share. This is because manufacturing and services had very similar labour shares in the early 1990s, so a shift in resources between the two sectors has had little discernible effect.
Guided by economic theory and overseas research, three leading explanations for trends in factor shares across industries include:[7]
- Technology: A decrease in the cost of capital (e.g. lower relative price of investment goods or interest rates) or higher capital-augmenting technological change (e.g. automation) will lower the labour share of income.
- Globalisation: A decrease in the cost of foreign labour relative to domestic labour (for example, due to the rise of Chinese manufacturing, offshoring and/or global value chains) will lower the domestic labour share.
- Market power: A decrease in labour bargaining power (as firms extract greater monopoly rents in product or labour markets) will lower the labour share.
The effect of technology
Overseas research has indicated that technological advancement can affect aggregate factor shares. Greater technological progress will be associated with a lower aggregate labour share if that technical change is ‘capital augmenting’ in that it increases worker productivity without a corresponding increase in real wages. Examples of such technical progress could include the development of computer software that makes hardware work more efficiently.
Technological progress may have also affected the aggregate labour share by lowering the relative price of investment goods. This lowers the cost of capital for firms and provides an incentive to replace labour with capital. So the rapid advance in information and communications technology, which underpins much of the decline in the relative price of investment goods over recent decades, may have reduced the labour share.
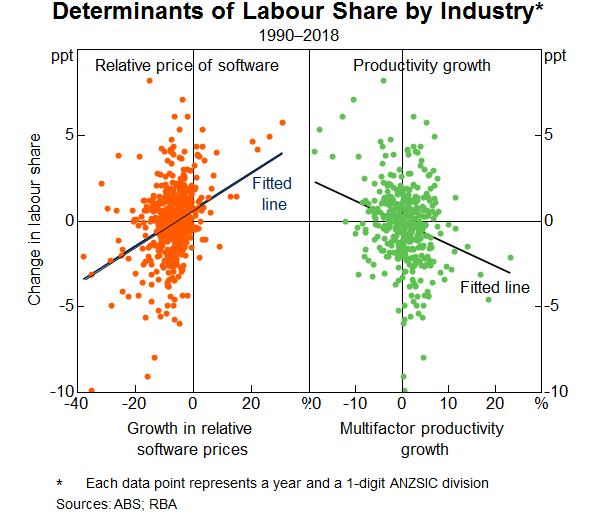
There is strong statistical evidence of a relationship between the labour share and both total factor productivity growth and the relative price of IT goods across Australian industries (Graph 13). Regression analysis indicates that the labour share has declined by more in industries experiencing faster productivity growth and larger falls in the relative price of IT goods. These relationships hold even when controlling for a wide range of other factors, such as demand conditions in the industry.
The effect of globalisation and the rise of Chinese imports
There is a large body of international research looking at the effect of trade, and the rise of Chinese imports in particular, on the labour share of income. But the existing research indicates that the effect of higher import penetration on the labour share is ambiguous.
A key reason for this ambiguity is that higher import competition not only reduces employment and earnings, but also profits, which may imply a higher and not lower labour share. Over the past decade or so, there has been a decline in employment and labour costs in manufacturing industries that were most exposed to Chinese import competition, such as electronics, clothing and toys. But business profits have fallen by even more in these highly exposed industries. The net effect is that the labour share has actually risen in the most affected industries.
If anything, the fall in the labour share in Australian manufacturing appears to pre-date the strong increase in Chinese imports by a few decades (this is also true for many other industrialised countries where the labour share declined even more). In this earlier period, increasing globalisation was still part of the explanation, for example, by motivating the reduction in government protection, which coincided with a lower labour share in manufacturing through the 1980s and 1990s.
The rise of China has also affected the aggregate labour share indirectly through its effect on the demand for Australian resources and hence labour and capital used in the mining sector. Following the emergence of China as a global exporter in the early 2000s, the labour share in the mining sector declined because mining company profits rose more strongly than wages; but since then, the labour share has risen in the mining sector as both the terms of trade and company profits have declined.
The effect of changes in market power
An alternative explanation for the decline in the labour share in some industries is that Australian workers have lost bargaining power. This loss of bargaining power could reflect a range of factors, such as lower job protection regulation, a decline in union protection or an increase in the concentration of economic activity among a few large ‘superstar’ firms.
The implications of labour market deregulation for the labour share are unclear. Recent overseas research suggests that job protection deregulation reduces the labour share (Ciminelli, Duval and Furceri 2018). But other studies suggest that the labour share declined by more in more regulated labour and product markets (Ellis and Smith 2010).[8] While some studies find that the Australian labour market has become more flexible over time, there is no Australian evidence that directly links changes in the labour share to changes in job protection legislation.
There is some international evidence to suggest a positive but weak link between a decline in unionisation and the labour share. In Australia, there has been a broad-based decline in union membership across industries over recent decades, but recent research suggests that there is little evidence of a link to wage outcomes (Bishop and Chan 2019). This may be because actual union coverage of Australian workers has been little changed since the early 1990s; union involvement in enterprising bargaining agreement (EBA) negotiations ultimately affects all employees on an EBA, and not just union members.
An alternative explanation for the decline in the labour share is the ‘superstar hypothesis’ (Autor et al 2017). This hypothesis states that lower labour shares within industries reflect the increasing dominance of a few large firms that produce a lot of output with relatively little labour. Any shift in economic activity towards these very productive firms could explain the observed decline in the share of income going to labour within industries.
Research using detailed firm-level data finds some evidence for higher business concentration in Australia (La Cava and Hambur 2018). Since the early 2000s, there has been a shift in economic activity towards large firms. This is true across a range of industries, but is most notable in the retail trade sector. The four largest retailers in Australia now account for around one-third of total industry sales. Statistical analysis suggests that higher business concentration across industries has lowered the aggregate labour share since the early 2000s.
Conclusion
The aggregate labour share in Australia rose over the 1960s and early 1970s but has been on a gradual decline since then. In an accounting sense, the decline in the aggregate labour share over recent decades is largely because of a larger share of imputed income accruing to home owners, along with a lower labour share in the financial sector. The decline in the financial sector labour share, in turn, appears to be partly due to structural changes in the financial sector, such as financial deregulation, labour-saving technology adoption and high productivity growth. But it also may be affected by issues with measuring the output of the financial sector.
At the same time, the aggregate capital share has risen. This is largely explained by rising profits accruing to financial institutions and rising rents paid to land owners. In turn, higher housing rents over recent decades appear to reflect a combination of higher-quality owner-occupied housing, lower interest rates and rising housing prices. Across the rest of the economy, there have been varying trends in factor shares that are largely offsetting.
Appendix A: How Are the Labour and Capital Shares of Income Measured?
The labour and capital shares of income measure the fractions of domestic income going to labour and capital respectively. While these concepts may be intuitive, it can be hard to measure both labour and capital income.
Labour income typically measures the compensation of employees, which includes wages and salaries (in cash and in kind) and employers' social contributions (such as payments to pension and superannuation funds). It does not include any voluntary unpaid work or payroll taxes. Capital income usually refers to both gross operating surplus (GOS) and gross mixed income (GMI). This income is derived as the excess of gross output over production costs before allowing for depreciation. GOS is the income from production by companies, while mixed income is the income from production by unincorporated businesses.[9]
The sum of compensation of employees, GOS and GMI is known as ‘total factor income’. In the national accounts, total factor income is equal to GDP less net taxes on production and imports. Given that these net taxes are relatively small as a share of GDP, total factor income and GDP are typically very similar, both in levels and trends.
There are two key challenges in separating total aggregate income into capital and labour income. First is the question of how to treat the income of the self-employed. Second is the issue of whether to measure total income on a net basis after deducting depreciation.
In standard national accounts, the profits of unincorporated business owners (the self-employed) are fully included in capital income. But at least some of this income is a return to labour effort, and hence should be included in labour income.
There are a number of ways to adjust the split between labour and capital income to account for this, but none of them are fully satisfactory. The labour and capital shares can be estimated without making any adjustment, which we refer to as the ‘unadjusted’ factor shares. But we also consider ‘adjusted’ estimates that apportion some of the GMI to labour income. This is done by assuming that, in a given industry, employees and self-employed workers both earn the same average wage.[10]
The national accounts estimates also do not deduct depreciation from capital income. The amount of income spent on depreciation is essentially ‘eaten up’ in the production process and is not distributed to either labour or capital. The distinction between gross and net income could be important because measured depreciation has been rising as a share of the aggregate capital stock due to a long-term shift towards fast-depreciating capital, such as computers and software. Some overseas studies suggest that measured depreciation is important to the long-run trends in the aggregate labour share.
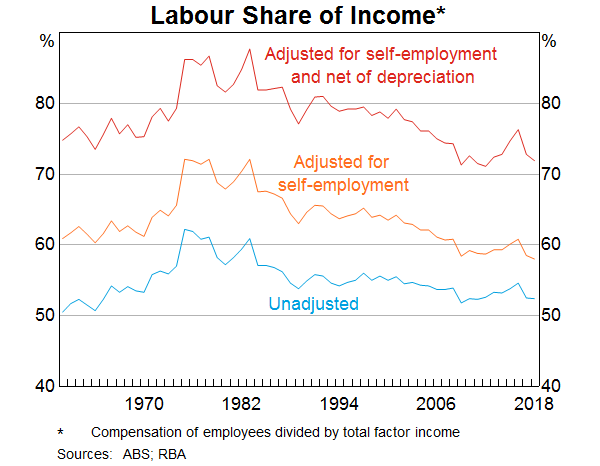
The adjustments for the labour income of the self-employed and the depreciation of the capital stock raises the level of the labour share and leads to a slightly larger decline over recent decades (Graph 14). This is apparent from a comparison of the published estimates (the ‘unadjusted’ measure) and the estimate of the labour share that adjusts for self-employment income and is net of depreciation (the ‘adjusted’ net measure). The steeper decline in the adjusted labour share is due to the gradual fall in the share of workers that are self-employed, particularly in the farm sector.[11] The adjustment for depreciation affects the level, but makes little difference to the long-run trend.
The adjustments for the self-employed and depreciation also do not affect the story regarding the role of finance. There is still a clear decline in the labour share for the financial sector and, outside of finance, the labour share has been trending sideways since 1990.
Footnotes
The author works in Economic Research Department. [*]
This is discussed in more detail in Appendix A. Gross mixed income has been on a trend decline since the 1960s because of a decline in the farm sector's share of the economy and a declining share of self-employed workers. [1]
The increase in the share of total household income spent on housing may also be due to a shift in preferences to housing. But, if this were the case, we should observe an increase in the share of income spent on both owned and rented housing. Instead, we observe a strong increase in housing prices over recent decades alongside an even larger increase in the demand for owner-occupier housing services. This is more consistent with the rise in the housing share being due to a long-run decline in credit constraints and an increase in demand for better housing in Australia. [2]
The growth in financial sector output has been partly driven by the growth in output of insurance companies and superannuation funds. But detailed ABS data indicate that banking is the main source of output growth within the sector. [3]
Problems in measuring output are a feature of other services industries too, such as education and health. As a result, statistical authorities often do not even attempt to measure productivity in these industries. [4]
Reserve Bank staff research indicates that there were competing factors affecting banking profits during the 1980s and 1990s that were potentially offsetting. Lower interest rates and higher productivity were lifting bank profits, while higher competition in the mortgage market was lowering bank profits through lower loan spreads. This research suggests that the interest rate and productivity effects outweighed the competition effects, so profits increased. [5]
This is true regardless of whether the labour share is adjusted for depreciation and self-employment. [6]
These explanations for the changes in factor shares are not independent of each other. For instance, a decrease in the cost of investment goods may have boosted profit margins for large companies and given them more power to bargain with workers. Labour bargaining power may also decline because of technological change, for example, because faster rates of innovation make current skills obsolete more quickly. [7]
This is because faster rates of technological innovation can lead to higher rates of labour churn; when hiring and firing costs are high (and hence the labour market is more rigid), this can reduce labour's bargaining power and thus income share. [8]
Both GOS and GMI are measured before deducting any explicit or implicit interest charges, rent or other property incomes payable on the financial assets, land or other natural resources required to carry on production. [9]
A common alternative approach is to assume that two-thirds of GMI is attributable to labour income. This rule of thumb is reasonable in some contexts, but is likely to be flawed for certain industries. [10]
The decline in self-employment is at least partly due to the increasing tax incentive to incorporation. [11]
References
ABS (Australian Bureau of Statistics) (2018), ‘Trends in the Labour Income Share in Australia’, Australian Bureau of Statistics Feature Article, 24 1. Available at <http://www.abs.gov.au/ausstats/abs@.nsf/Lookup/5260.0.55.002Feature+Article32016-17>.
Autor D, D Dorn, LF Katz, C Patterson and J Van Reenen (2017), ‘Concentrating on the Fall of the Labor Share’, American Economic Review, 107(5), pp 180–185.
Bishop J and I Chan (forthcoming), ‘Is Declining Union Membership Contributing to Low Wages Growth?’, RBA Research Discussion Paper.
Ciminelli G, RA Duval and D Furceri (2018), ‘Employment Protection Deregulation and Labor Shares in Advanced Economies’, IMF Working Papers 18/186.
Dao MC, M Das, Z Koczan and W Lian (2017), ‘Why is Labor Receiving a Smaller Share of Global Income? Theory and Empirical Evidence’, IMF Working Paper 17/169.
Ellis L and K Smith (2010), ‘The Global Upward Trend in the Profit Share’, Applied Economics Quarterly, 56(3), pp 231–256.
Elsby MW, B Hobijn and A Sahin (2013), ‘The Decline of the U.S. Labor Share’, Brookings Papers on Economic Activity, 44(2), pp 1–63.
Gizycki M and P Lowe (2000), ‘The Australian Financial System in the 1990s’, in The Australian Economy in the 1990s Conference, Proceedings of a Conference, Reserve Bank of Australia, Sydney, pp 180–215.
Haldane A (2010), ‘The Contribution of the Financial Sector – Miracle or Mirage?’, The Future of Finance Conference at the Bank of England, London, 14 July.
Kaldor N (1957), ‘A Model of Economic Growth’, Economic Journal, 67(268), pp 591–624.
La Cava G and J Hambur (2018), ‘Business Concentration and Mark-ups in the Retail Trade Sector’, RBA Bulletin, December.
La Cava G (2016), ‘Housing Prices, Mortgage Interest Rates and the Rising Share of Capital Income in the United States’, RBA Research Discussion Paper No 2016-04.
Neiman B and L Karabarbounis (2014), ‘The Global Decline in the Labor Share’, Quarterly Journal of Economics, 129(1), pp 61–103.
Parham D (2013), Labour's Share of Growth in Income and Prosperity, Visiting Research Paper, Productivity Commission, Canberra.
Piketty T and G Zucman (2014), ‘Capital is Back: Wealth-Income Ratios in Rich Countries 1700–2010’, The Quarterly Journal of Economics, 129(3), pp 1255–1310.
Rognlie M (2014), ‘A Note on Piketty and Diminishing Returns to Capital’. Available at <http://mattrognlie.com/piketty_diminishing_returns.pdf>
Rognlie M (2015), ‘Deciphering the Rise and Fall in the Net Capital Share: Accumulation or Scarcity?’, Brookings Papers on Economic Activity, 46(1), pp 1–54. Available at <https://www.brookings.edu/wp-content/uploads/2016/07/1_2015a_rognlie.pdf>
Trott D and L Vance (2018), ‘Adjusting the Australian Labour Share for Depreciation, Housing and Other Factors, 1960–2016’, Economic Papers, 37(4), pp 412–428.
Zieschang KD (2016), ‘FISIM Accounting’, CEPA Working Paper Series WPO12016.