Bulletin – March 2018 Australian Economy Structural Change in the Australian Economy
- Download 642KB

Abstract
Since the mid 1960s, the structure of the Australian economy has changed significantly. Services have become an increasingly important part of the economy. Supply chains have lengthened as goods-producing industries have become more specialised in their core activities and outsourced their non-core activities to the business services sector. These developments have had significant implications for the composition of employment and the skill requirements of the Australian labour force.
Introduction
The structure of the Australian economy has changed significantly over the past 50 years. This article explores how the relative importance of different sectors and their interaction with each other has changed over time. The business services sector has become an increasingly important part of the economy, both in terms of its output share and in its integration in the production of other sectors' goods and services. Supply chains have also lengthened, with the peak of this trend coinciding with a period of relatively high growth in total factor productivity. The rising importance of business services has also affected the labour market and the types of skills required. In recent decades, job growth has been in occupations that require higher-level cognitive skills.
The Changing Composition of Growth
Over the past 50 years, the sectoral composition of the Australian economy has shifted away from goods and towards services. The share of services has risen in consumption, production, employment and exports. This shift towards services is a common feature of economic development; as economies become wealthier and incomes rise, consumers typically spend a greater share of their income on services compared to goods.[1]
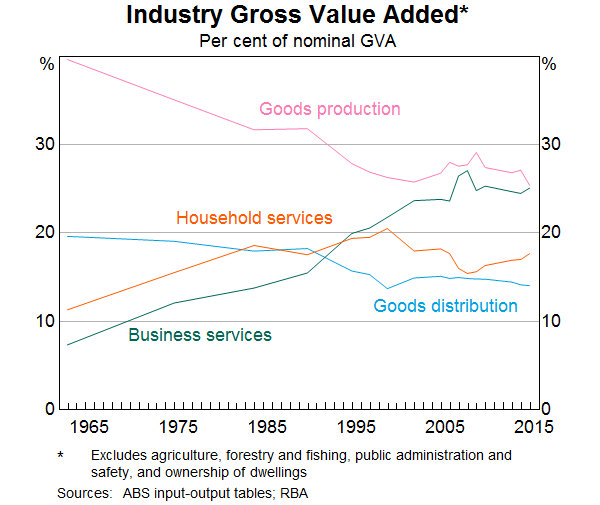
In Australia, the services share of production – as measured by gross value added (GVA) – doubled from around 20 per cent in the mid 1960s to around 40 per cent more recently. Over this period, the share of business services increased from less than 10 per cent of GVA to around 25 per cent (Graph 1). It has grown to be comparable in size to the goods production sector.[2]
The business services sector is very broad but can be thought of as the group of firms which provide assistance to other businesses. This includes consulting services, financial advice and equipment leasing, in addition to more traditional business services such as accounting and legal services. Within the business services sector, the largest industries are ‘financial and insurance services’ and ‘professional, scientific and technical services’ (Graph 2).[3] These two industries have also increased the most as a share of GVA over the past few decades. The falling GVA share of the information, media and telecommunications industry is a result of weak growth in prices restraining nominal growth; in real terms, this industry has grown the most of all the industries within business services.
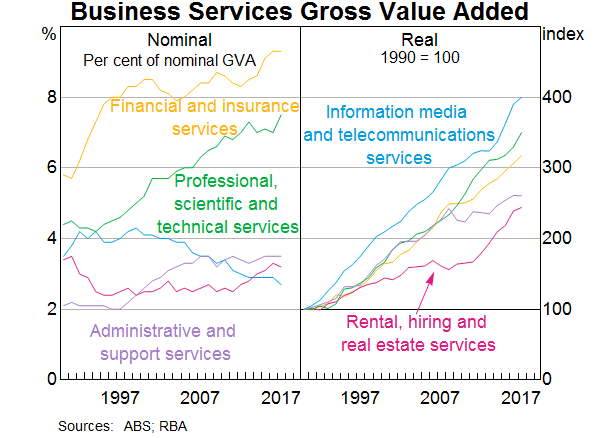
The increase in the share of business services has partly reflected the development of completely new services in the economy, such as internet publishing, internet service providers and data processing services. The rising share can also partly be explained by improved data coverage. For example, construction services were only included in Australia's input-output tables in the early 2000s (see Appendix B for more details).
There have also been significant changes in the way that the business services sector interacts with other sectors in the economy. In particular, the outsourcing of activities that are essential for the operation of most firms, such as recruitment or IT, has been a key factor behind the increasingly important role that the business services sector plays in the Australian economy. This and other issues can be examined by looking at developments in sectoral supply chains and the linkages between sectors.
Supply Chains
Supply chains measure how long the production process is for any given good or service; that is, how many steps there are from the initial inputs to final demand. These steps can span many different industries and sectors, creating connections and interdependencies across the economy as the outputs of some industries are the inputs to others.
It has been well documented that global supply chains have lengthened over time as production has become more fragmented across countries.[4] This is also true for supply chains within Australia, though research is more limited.[5] What has not been as extensively examined is how this trend of lengthening supply chains has differed on a sectoral basis. One way this can be done is by using data from input-output tables, following the methods of Antràs et al (2012) and Fally (2012).[6] The following measures separately estimate the length of downstream and upstream supply chains:
- To assess the downstream side of the supply chain, ‘upstreamness’ measures the average number of stages there are between a given sector's production of a good or service and final demand.[7]
- For the upstream side of the supply chain, ‘fragmentation’ measures the number of stages involved in the production of a good or service for a particular sector and how the overall value-added of the product is distributed along these stages.[8]
For example, consider a firm in the manufacturing sector that produces bread. The firm's downstream supply chain, its upstreamness, measures the number of stages between production and the final consumer, such as distribution to a supermarket where the bread is sold. The firm's upstream supply chain, its fragmentation, measures the number of stages involved in production, such as purchasing flour from a supplier.
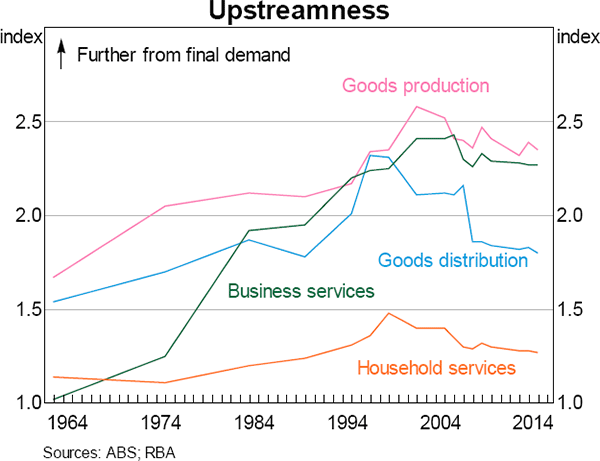
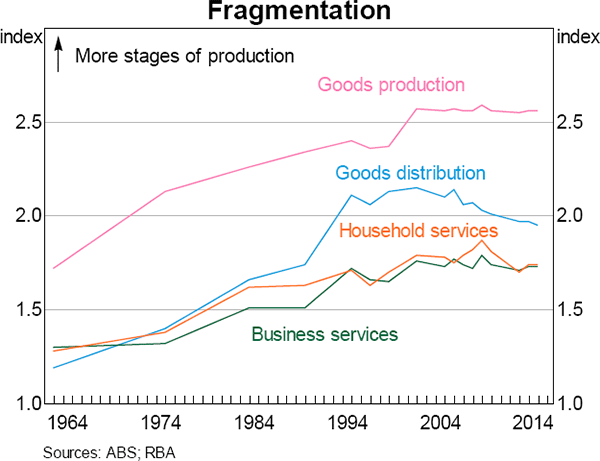
Supply chains have lengthened for all sectors in the Australian economy over the past 50 years or so; measures of both upstreamness and fragmentation have increased (Graph 3 and Graph 4). This means that all sectors have become more integrated into each other's production processes over time. Most of these changes occurred before the 2000s; since then, most supply chains have stopped growing and in some cases have shortened a little.
The business services sector has experienced the largest increase in upstreamness over time, which suggests that the sector has become increasingly integral to other sectors' production processes. Goods production is the most upstream sector; firms which manufacture goods do not typically sell them directly to consumers. Household services is the most downstream sector, which is to be expected as many of these services, such as medical care, are required by their nature to be provided direct to consumers. It is interesting that the increase in upstreamness in the goods distribution sector has notably reversed in the past decade or so. This might reflect outsourcing of supply chain and logistics services in the earlier period, and the rise of online retail and increasing business-to-customer logistics more recently.
Goods production is also the most fragmented sector; production in this sector uses the most intermediate inputs of all sectors. For example, it takes many inputs to manufacture a product or construct a building. This is in contrast to household and business services which use relatively few inputs from other sectors to produce their output. Over time the upstream supply chains of all sectors have become longer, which means they are relying on each other more in their production.
Changing Linkages between Sectors
Detailed supply chain connections between sectors can be observed using input-output table data. Specifically, the additional activity generated from an extra dollar of output from one sector can be measured all the way through the upstream supply chain by observing which other sectors supply it with intermediate inputs. This activity can be expressed in terms of the additional GVA that a given sector would have to produce to meet the input needs resulting from higher output in another sector.[9]
The upstream effects of goods production
As the goods production sector is the most fragmented – that is, requiring the most stages of production – any additional output from the sector will have notable flow-on effects for activity in other sectors. This effect has increased over time, as fragmentation of the goods production sector has increased. This does not necessarily mean a greater absolute level of activity in the economy, just that there has been a shift in the sectors where the activity has taken place.
The firms most affected by an increase in output of the goods production sector are other firms within that sector (Graph 5). In 2014/15 specifically, a $1 increase in gross output from goods production required $0.6 GVA from other goods-producing sectors, $0.2 from business services and small amounts from goods distribution and household services.
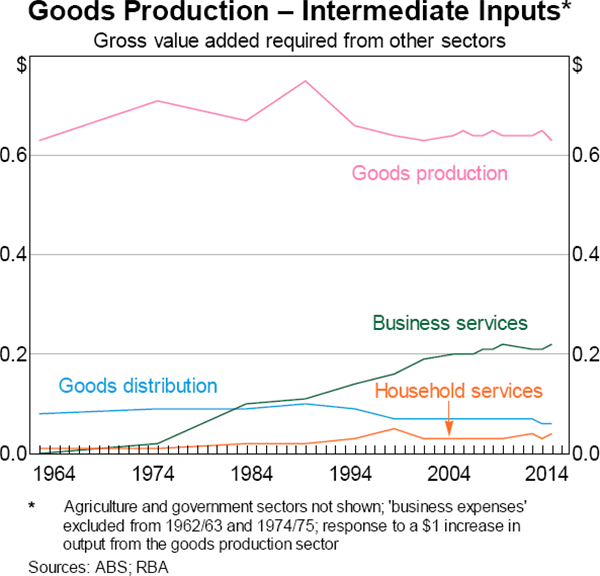
The goods production sector has increasingly relied on intermediate inputs from the business services sector for a given level of output, at least since the 1960s. In contrast, the required inputs from other sectors have been broadly stable. This means that the increase in fragmentation of the goods production sector has been primarily driven by increasing reliance on inputs from the business services sector.
One explanation for this is that the industries within the goods production sector have become more specialised in their core activities over time and are relying more on inputs from the business services sector as a result. While the goods production sector may have, for example, produced its own accounting and legal services in-house in the past, these activities are now outsourced to other specialised businesses. This supports the idea that economic activity has been reorganising across sectors, particularly over the 1990s.
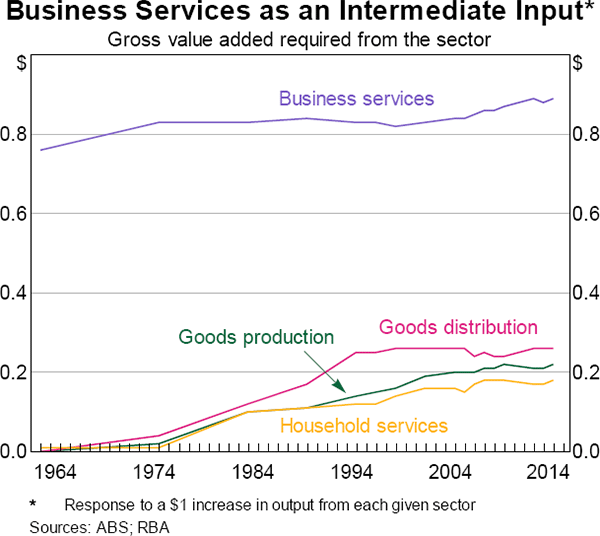
The increasing integration of the business services sector into the supply chains of other sectors is not limited to the goods production sector. Indeed, the required inputs from the business services sector for a given level of output have increased for all sectors over the past fifty years (Graph 6).
Supply Chains and Productivity
The period of time when supply chains were lengthening most notably in Australia corresponds with a period of high growth in total factor productivity (TFP), particularly in the 1990s (Graph 7). Despite the challenges in attributing productivity growth to any one factor, it is possible that the reorganisation in economic activity and firms' outsourcing of their non-core activities to the business services sector has led to a more efficient allocation of activities across the economy. Technological advances and, by extension, stronger TFP growth, are likely to have enabled more integration between industries. Lower cost and more efficient communication has made it easier for firms to use the services of other firms in producing their own output. At the same time, the more interrelated industries are, the easier it is to share technologies and productivity gains across the economy (Dao et al 2017).
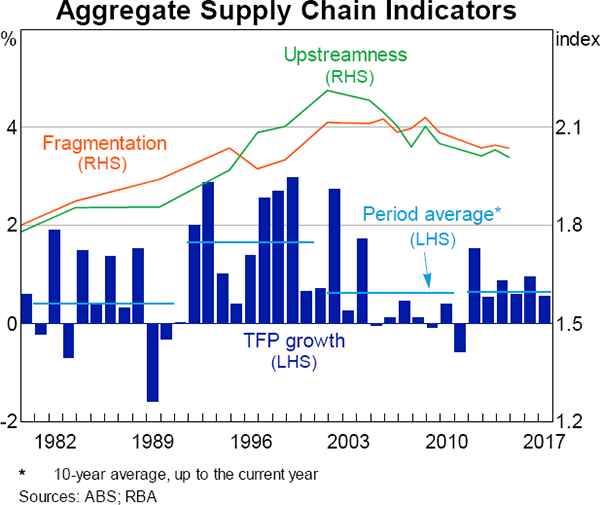
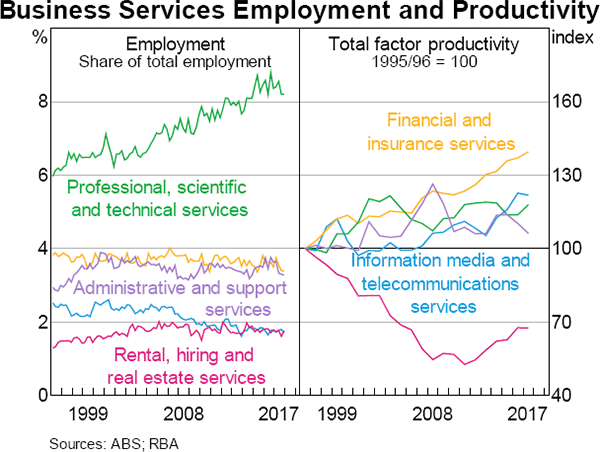
In the early 2000s, measures of supply chain length stopped increasing and have since declined a little, coinciding with a period of comparatively lower TFP growth. However, the business services sector has continued to grow in terms of output share and employment share. This is inconsistent with the observation that during the 1990s, growth in business services was associated with increasing integration of sectors and related efficiency gains. This could be because growth has been driven by industries with relatively low total factor productivity. For example, the professional, scientific and technical services industry's output and employment shares have grown moderately since the 2000s, while its TFP has remained relatively flat (Graph 8). However, it is also the case TFP has been relatively subdued for most industries within business services.
The Effect of the Rise in Business Services on the Labour Market
Growth in the business services sector has not only transformed supply chains and the sectoral composition of growth in Australia, but has also affected the labour market. The composition of employment in Australia has moved away from a large share of labour in the manufacturing and mining sectors and towards services sectors. The share of people employed in the business services sector has almost doubled over the past 50 years, to be almost 20 per cent in 2016. This is consistent with the sector becoming an increasingly important and integrated part of the Australian economy, and has implications for the types of jobs available and their required skills.
Timmer et al (2014) found that lengthening of supply chains and the associated reorganisation of activity has led to a shift towards high-skilled labour, and this has been more pronounced in advanced economies, such as Australia. Indeed, the share of employment in routine manual jobs, which are most often related to the goods production sector, has declined in Australia over recent decades, and there has been an offsetting increase in the share of employment in non-routine jobs (Heath 2016).[10]
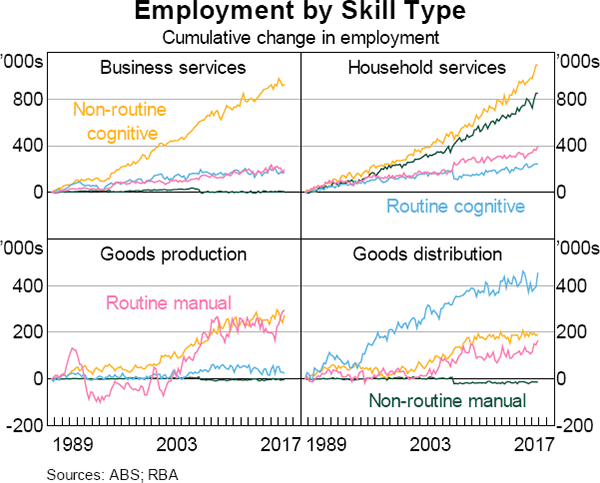
Most of the growth in business services employment has been in non-routine cognitive jobs; these jobs have also contributed to employment growth in other sectors (Graph 9). Household services employment has been driven by both cognitive and manual non-routine jobs, and employment in the goods production sector has been driven by non-routine cognitive jobs as well as routine manual jobs. Understanding which jobs are increasingly in demand and the specific skills they require is important so that the labour force can adapt to the evolving structure of the economy.
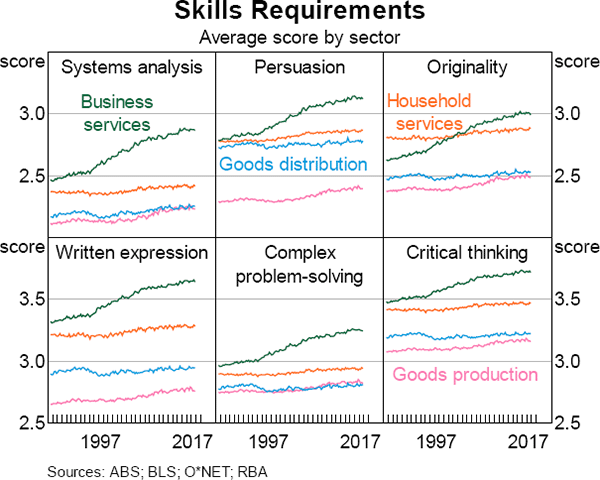
Further detail on how the labour force is changing can be observed by looking at the specific skills required by particular occupations. The US Occupational Information Network (O*NET) database provides information on the abilities, skills, interests, tasks and tools used for particular occupations. The required level of each characteristic is rated on a scale of 1 to 7 for each occupation. By matching these data to Australian occupations, insights can be gained into the specific skills requirements for occupations within different sectors. Graph 10 shows the average required level of a selection of skills and abilities for each sector and how growth in occupations which require those skills has changed over time.[11]
Occupations that require higher-level cognitive skills, such as systems analysis, persuasion, originality, written expression, complex problem-solving and critical thinking have become increasingly important in recent decades. This is particularly the case for the business services sector. These skills have almost always been required more by occupations in the business services sector than other sectors, and employment growth within the sector has further shifted to these occupations in recent decades. Nonetheless other sectors, particularly goods production, have also seen some growth in occupations requiring these skills in recent decades.
Technological change has also played a role in the changing nature of work. Advances in computer-based technology have been an important driver of the shift from routine to non-routine jobs (Autor, Levy and Murnane 2003). But evidence for Australia suggests that, while technology has made some jobs obsolete, it has created other new jobs, and the pace of structural change in the labour market as a result of technological innovation is not any greater now than it was in the past (Borland and Coelli 2017).
Conclusion
Two key trends have provided evidence of substantial reorganisation of economic activity over the past 50 years. Supply chains have lengthened, particularly during the 1990s, which was a period associated with relatively high total factor productivity growth. The business services sector has become an increasingly important part of the economy as it has become more integrated into the supply chains of other firms, as firms in other sectors specialise in their core activities. This reorganisation has had implications for the labour market; business services employment has increased, and this growth has been driven by occupations which require high-level cognitive skills.
Appendix A Data
This article disaggregates the economy into four sectors:
- goods production (mining, manufacturing, construction and utilities)
- goods distribution (wholesale trade, retail trade and transport, postal and warehousing)
- business services (information, media and telecommunications, financial and insurance services, rental, hiring and real estate services, professional, scientific and technical services, and administrative and support services)
- household services (accommodation and food services, education and training, health care and social assistance, arts and recreation services, and other services).
While the definitions of industries have changed somewhat over time, reasonable adjustments were made to ensure consistency in the sample.
Input-output tables provide one way of measuring the connections between various industries. They contain data on how output from a given industry is distributed between intermediate use by other industries and final demand. The tables allow interdependencies between various industries to be examined. Input-output tables for Australia are published by the Australian Bureau of Statistics (ABS) and are available at varying intervals beginning in the late 1950s and most recently for 2014/15. This article uses 17 of the 28 available input-output tables for Australia.[12]
Appendix B Measurement of the Business Services Sector
There are many challenges with measuring business services because the output of the sector is not tangible in the way that it is for the goods production sector; this can also make the sector particularly difficult to examine over time. Some of the increasing importance of business services can be attributed to better data coverage of the business services sector over time.
Better coverage of the business services sector can be observed in the number of activities included in the input-output tables; in the 1962/63 tables there were 69 manufacturing categories and 6 business services categories, while in the 2014/15 tables the number of manufacturing categories measured had declined to 51 and business services categories had increased to 16. The ABS continues to respond to structural changes in the economy by periodically redefining industry classifications in order to capture data that better reflect the realities of our changing economy.
The inclusion of more business services categories sometimes reflects improvements in measurement making it possible to incorporate into the data activities that were difficult to measure in the past. One such example is construction services, which includes activities like bricklaying and carpentry services. Construction services were only accounted for in the input-output tables in the early 2000s, despite these activities being in existence for much longer.
But the inclusion of more business services categories can also reflect the development of completely new services in the economy. Such services include internet publishing, internet service providers and data processing services. The origination of these services and their inclusion in input-output tables has meant that the traditional communication services industry (which included just postal, courier and telecommunications services) has been broadened in scope to become the information media and telecommunications industry.
Footnotes
The author is from Economic Analysis Department and would like to thank James Foster, Cameron Dark, and others for their assistance. This article presents the background work to Heath (2017). [*]
See Kuznets (1973). In Australia, the shift towards services has been well documented: see Dowie (1970), Maddock and McLean (1987), McLachlan, Clark and Monday (2002), Connolly and Lewis (2010) and Manalo and Orsmond (2013). [1]
This article disaggregates the economy into four sectors: goods production, goods distribution, business services and household services. See Appendix A for details of the industries within these sectors. [2]
‘Professional, scientific and technical services’ includes activities such as architectural, legal, accounting, advertising, management consulting, and computer system design services. [3]
See Hummels, Ishii and Yi (2001), Johnson and Noguera (2012), Los, Timmer and de Vries (2015), De Backer and Miroudot (2014), Timmer et al (2014), and Francois, Manchin and Tomberger (2015). [4]
See Kelly and La Cava (2014). [5]
There are various ways that the length of supply chains can be estimated. See Fally (2012) for a summary. See Appendix A for a description of the input-output table data used in this analysis. [6]
As the length of the downstream supply chain of a sector becomes longer, that sector becomes more upstream (an increase in upstreamness) and vice versa. [7]
For details on the calculation of upstreamness and fragmentation, see Antràs et al (2012), Fally (2012), and Kelly and La Cava (2014). [8]
See Rayner and Bishop (2013) for details on the calculation of GVA requirements. [9]
See Heath (2016) for details on the classification of routine/non-routine and manual/cognitive occupations. [10]
The required level of characteristics for each occupation was only collected at one point in time, which means that changes in these scores reflect changes in the composition of the occupations required in each sector, rather than changes in the skills required for a given occupation over time. [11]
The tables used have an indirect allocation of imports, see Appendix B of Kelly and La Cava (2014) for a detailed explanation on the treatment of imports. For an introduction to input-output tables, see McLennan (1995). [12]
References
Antràs P, D Chor, T Fally and R Hillberry (2012), ‘Measuring the Upstreamness of Production and Trade Flows’, American Economic Review, 102(3), pp 412–416.
Autor DH, F Levy and RJ Murnane (2003), ‘The Skill Content of Recent Technological Change: An Empirical Exploration’, The Quarterly Journal of Economics, 118(4), pp 1279–1333.
Borland J and M Coelli (2017), ‘Are Robots Taking Our Jobs?’, The Australian Economic Review, 50(4), pp 377–397.
Connolly E and C Lewis (2010), ‘Structural Change in the Australian Economy’, RBA Bulletin, September quarter, pp 1–10.
Dao MC, M Das, Z Koczan and W Lian (2017), ‘Why is Labor Receiving a Smaller Share of Global Income? Theory and Empirical Evidence’, IMF Working Paper WP/17/169.
De Backer K and S Miroudot (2014), ‘Mapping Global Value Chains’, ECB Working Paper No 1677, May. Available at <https://www.ecb.europa.eu/pub/pdf/scpwps/ecbwp1677.pdf?11ce331dcdb55ca6ba38f8b0c288c4a4>.
Dowie JA (1970), The Service Ensemble, Australian Economic Development in the Twentieth Century, Allen and Unwin, London.
Fally T (2012), ‘Production Staging: Measurement and Facts’, unpublished manuscript, University of Colorado-Boulder, August, unpublished manuscript. Available at <https://www2.gwu.edu/~iiep/assets/docs/fally_productionstaging.pdf>.
Francois J, M Manchin and P Tomberger (2015), ‘Service Linkages and the Value Added Content of Trade’, The World Economy, 38(11), pp 1631–1649.
Heath A (2016), ‘The Changing Nature of the Australian Workforce’, Speech at CEDA – Future Skills: The Education and Training Pipeline, Brisbane, 21 September.
Heath A (2017), ‘Structural Change in Australian Industry: The Role of Business Services’, Speech at the Economic Society of Australia, Hobart, 6 September.
Hummels D, J Ishii and K-M Yi (2001), ‘The Nature and Growth of Vertical Specialization in World Trade’, Journal of International Economics, 54, pp 75–96.
Johnson RC and G Noguera (2012), ‘Proximity and Production Fragmentation’, American Economic Review, 102(3), pp 407–411.
Kelly G and G La Cava (2014), ‘International Trade Costs, Global Supply Chains and Value-added Trade in Australia’, RBA Research Discussion Paper No 2014-07.
Kuznets S (1973), ‘Modern Economic Growth: Findings and Reflections’, American Economic Review, 63(3), pp 247–258.
Los B, MP Timmer and GJ de Vries (2015), ‘How Global are Global Value Chains? A New Approach to Measure International Fragmentation’, Journal of Regional Science, 55(1), pp 66–92.
Maddock R and IW McLean (1987), The Australian Economy in the Very Long Run, Cambridge University Press.
Manalo J and D Orsmond (2013), ‘The Business Services Sector’, RBA Bulletin, March quarter, pp 1–10.
McLachlan R, C Clark and I Monday (2002), ‘Australia's Services Sector: A Study in Diversity’, Productivity Commission Staff Research Paper. Available at <http://www.pc.gov.au/research/supporting/service-sector/assasid.pdf>.
McLennan W (1995), ‘Australian National Accounts: Introduction to Input-Output Multipliers’, Australian Bureau of Statistics Information Paper, 25 April. Available at <http://www.abs.gov.au/AUSSTATS/abs@.nsf/DetailsPage/5246.01989-90?OpenDocument>.
Rayner V and J Bishop (2013), ‘Industry Dimensions of the Resource Boom: An Input-Output Analysis’, RBA Research Discussion Paper No 2013-02.
Timmer MP, AA Eurmban, B Los, R Stehrer and GJ de Vries (2014), ‘Slicing Up Global Value Chains’, Journal of Economic Perspectives, 28(2), pp 99–118.