Bulletin – March 2018 Australian Economy Mining Investment Beyond the Boom
- Download 541KB
Abstract
With the construction phase of Australia's mining boom largely complete, this article investigates the outlook for mining investment over the next decade or so. Using two complementary approaches, our analysis suggests that mining investment will likely make up a larger share of GDP than it did before the boom.
Introduction
Resource companies have undertaken large-scale capital expenditure (capex) to increase the productive capacity of the Australian resources sector over the past decade, incentivised by an increase in global demand for coal, iron ore and liquefied natural gas (LNG), and an expectation that commodity prices would remain elevated for some time. This period of ‘expansionary capex’ saw total mining investment increase from an average of around 2 per cent of GDP in the decade or so before the boom to a peak of about 9 per cent in 2012/13 (Graph 1). The surge in investment saw the Australian mining sector roughly double its share of the economy's capital stock and increase its share of total output.
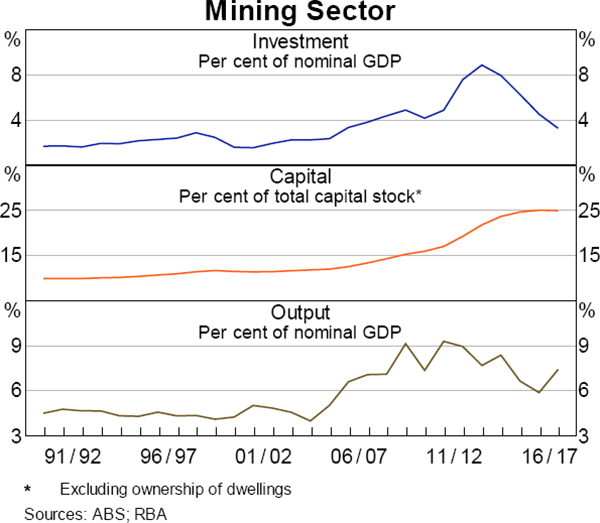
With the wind-down of the mining investment boom largely complete, mining investment over the next few years is expected to be driven by firms seeking to maintain their existing level of productive capacity (‘sustaining capex’). Given the increase in the capital stock over the past decade, the level of sustaining capex is likely to be considerably higher than before the boom to ensure the new, higher level of production is maintained over time. At the same time, further large-scale expansions of coal, iron ore and LNG seem unlikely for at least the next few years, given the recent increases in productive capacity globally. In addition, growth in demand for iron ore and coal is expected to slow over time.[1] Nonetheless, as in the past, mining investment is likely to continue to fluctuate in any given year as expenditure in the sector is often lumpy.
This article investigates the outlook for mining investment in Australia over the next decade or so using two complementary approaches. First, we use a standard production function framework to estimate where the ratio of mining investment to GDP may settle over time based on long-run determinants of mining investment. We then take a bottom-up approach and consider the sustaining capex component of mining investment in more detail, focusing on the outlook for Australia's three major commodity exports – coal, iron ore and LNG – over the next 5 years.
Long-run Determinants of Mining Investment
A production function defines how much output is produced from available inputs – in this case labour and capital. For firms in the mining sector, the accumulation of capital is particularly important because of the capital intensive nature of production. Since firms accumulate capital through investment, a production function provides a useful starting point to investigate the long-run determinants of mining investment. We use a Cobb-Douglas production function, which is commonly used in the economic growth literature:
Where Y is mining output, K is capital, L is labour, A is multifactor productivity and α is the capital share of income.
This production-based framework implies that, in the long run, mining investment will be determined by: (i) the capital share of income; (ii) the rate of return on capital; (iii) the growth rate of mining output; and (iv) the depreciation rate. Long-run estimates of these variables allow us to determine the long-run values of some key economic ratios, such as the ratio of capital-to-output and investment-to-output. These ratios, along with the mining sector's share of total output, allow us to consider where mining investment's share of GDP is likely to settle in the long run.
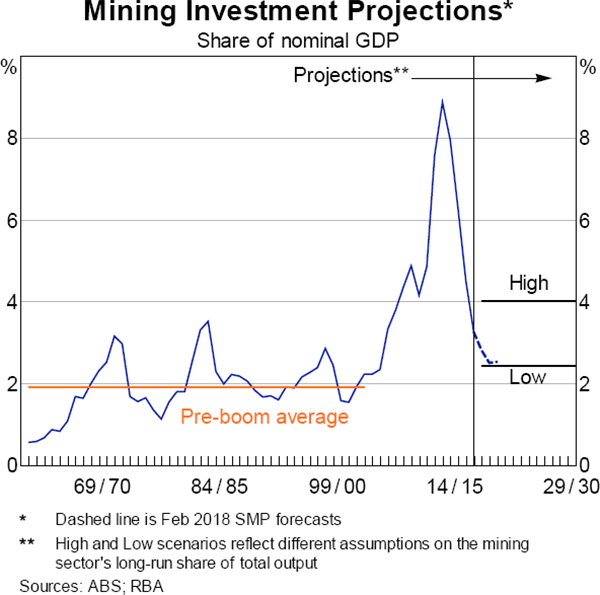
The key result of our analysis is that, based on a set of simple assumptions, mining investment's share of GDP is likely to be between 2½ and 4 per cent in the long run. This is higher than the 2 per cent average recorded over the decades preceding the mining boom; mining investment has risen to above 2½ per cent of GDP on only a handful of occasions over this period (Graph 2). We discuss our estimation of the long-run determinants of mining investment below.
Estimating the capital-to-output ratio
The capital-to-output ratio is a measure of the amount of capital that is used to produce a single unit of output. In the mining sector, capital includes machinery and equipment, as well as associated infrastructure (for example, railways, gas pipelines and ore processing facilities).
The Cobb-Douglas production function we have chosen to use implies that the long-run capital-to-output ratio (K/Y) depends on the capital share of income (α) and the return on capital (r):
The capital share of income (α) reflects the percentage of income generated in the mining sector that accrues to the firms' owners, as opposed to the share paid as wages to employees. The capital share of income in the Australian mining sector tends to fluctuate between 70 and 80 per cent (we assume a capital share of income of 76 per cent), and is much higher than the capital share of income in other goods-producing industries. The capital share in the mining sector may increase a little further over the next few years, as LNG is expected to account for a larger proportion of total mining production and LNG production is relatively more capital intensive than other commodities.
The rate of return on capital (r) is the income accruing to a firm for each dollar invested in the capital stock. Liaison and survey evidence suggests that firms across a range of sectors use a required rate of return (or ‘hurdle rate’) of around 15 per cent when assessing the viability of investment projects (Lane and Rosewall 2015); we use this rate in our calculations. Firms' hurdle rates are reported to be relatively constant over time and insensitive to changes in the cost of capital (for example, interest rates charged on debt). However, these rates vary substantially across firms, with Lane and Rosewall reporting a range of between 10 and 30 per cent. Variation in the realised return on capital should partly reflect differences in the productivity of firms' machinery and equipment. For example, a firm with more productive drilling equipment will require fewer capital inputs to produce a given amount of output. For this reason, a higher return on capital is associated with a lower long-run capital-to-output ratio.
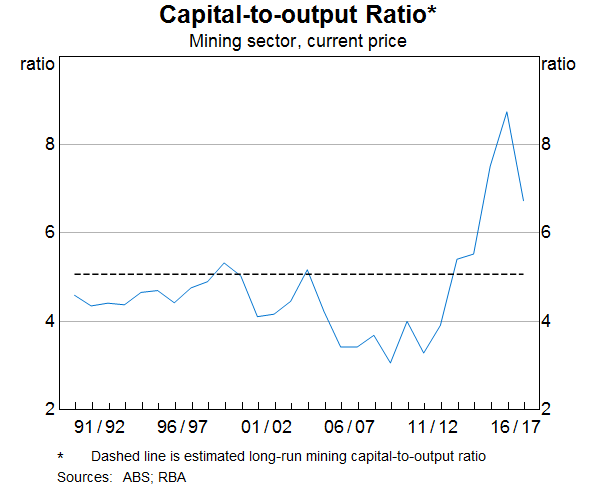
The capital-to-output ratio is currently well above our estimate of its long-run value of 5.1, although the gap has closed somewhat recently as production from the new additions to capacity has increased (Graph 3). Further declines are likely to occur over the next few years as production from the remaining LNG construction projects ramps up and few new major additions are made to the capital stock.
Estimating the investment-to-output ratio
The investment-to-output ratio is defined as the value of investment required to support a given level of production. Our approach implies that the long-run value of this ratio is determined by: (i) the long-run capital-to-output ratio (K/Y); (ii) the long-run growth rate of mining output (ΔY*); and (iii) the depreciation rate (δ). This ensures that there is sufficient investment to expand the capital stock to support growth in production, as well as to replace worn-out machinery and equipment.
There is a close relationship between mining production and investment. To increase output, firms must first invest in expanding mining capital. We have assumed that the capital required to produce one dollar of output is constant in the long run, implying that changes in production and capital match each other. Therefore, the faster firms wish to expand output, the more investment will be required to increase the stock of available capital.
Theory suggests that the long-run growth rate of output is driven by changes in productivity and the supply of labour. In practice, this calculation is complicated by difficulties with the measurement of productivity for the mining sector (Topp et al 2008). To avoid this complication, and to ensure that mining output settles at a stable share of total production, we assume that both nominal mining output and nominal GDP grow at 5 per cent in the long-run.
The depreciation rate, which measures the amount of firms' capital that is ‘consumed’ or worn out in a given period, is also an important driver of the long-run investment-to-output ratio. Within our framework, this means that some investment is required simply to offset depreciation and maintain the value of the existing stock of capital. It follows that a higher depreciation rate will require firms to invest more to maintain their existing capital. This is similar to the concept of ‘sustaining capex’ that we discuss in the next section.
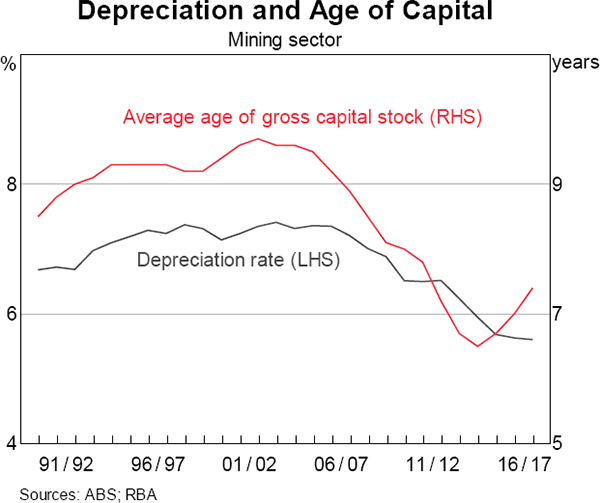
The Australian Bureau of Statistics (ABS) measure of the mining sector depreciation rate has fallen substantially over the past decade. This is likely explained by a compositional shift of the mining capital stock towards longer-lived assets, as well as a decline in the average age of the mining capital stock over this period (Graph 4).[2] As this capital ages, we might expect the depreciation rate to rise from its current level, increasing the amount of investment required to maintain the sector's existing productive capacity. For simplicity, we assume that the depreciation rate is unchanged from its current level of 5.6 per cent.
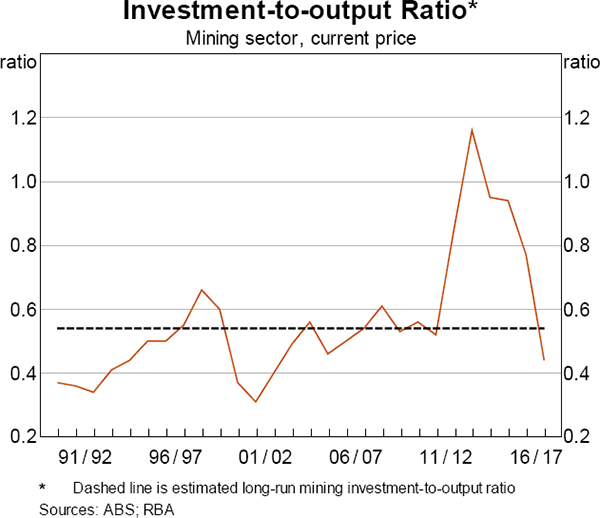
Bringing these variables together gives a long-run estimate of the mining investment-to-output ratio of 0.54, which is a bit above its current level (Graph 5). The investment-to-output ratio may remain below its long-run value in the near term as mining output continues to increase (led by the completion of LNG projects) and investment in capacity expanding projects remains subdued.
Mining investment as a share of GDP
We are interested in calculating the long-run value of mining investment as a share of total output, or GDP. So far we have estimated the long-run values for mining capital and investment as a share of mining output. To calculate the mining investment share of GDP, we need to estimate a long-run value for the mining sector's share of total output (Y/GDP). This will ensure that our results are consistent with the mining sector's relative importance in the economy.
There is uncertainty around where the mining sector's share of total output will settle in the long run. It is unlikely to decline to its pre-boom level (around 4½ per cent), although this provides a useful lower bound for our estimates (see Graph 1). The share that prevailed at the peak of the terms of trade is likely to be too high – even as an upper bound – given expectations of further declines in commodity prices, related to a moderation in demand and further increases in global supply. Instead, we consider an upper bound that is close to the mining sector's current share of output (7½ per cent). This range balances the possibility of further declines in commodity prices with expectations of continued growth in mining output as the final LNG projects are completed. This range of estimates for the mining sector's share of total output implies a long-run mining investment share of GDP of between 2½ and 4 per cent. Appendix A tests the sensitivity of this result.
The Outlook for Sustaining Capex
In this section we explore the outlook for sustaining capex – investment required to maintain firms' existing productive capacity – across Australia's three major commodities (coal, iron ore and LNG).[3] The analysis uses information from company reports, the Bank's liaison program and other data providers, allowing for a more detailed investigation of sustaining capex than is offered in the production function framework. The focus on sustaining capex is relevant as this type of expenditure is expected to make up the bulk of mining investment for the major commodities over the next few years. Only a small number of new expansionary projects are expected to be undertaken in the near term given few projects have been announced in recent years and exploration activity is at a low level.
Separate estimates of sustaining capex are made for each commodity to account for differences in the scale, nature and timing of investment across industries. In doing so, capex is separated into that related to ‘resource replacement’ and that for ‘asset-sustaining’ capex.
- Resource-replacement capex includes expenditure on new replacement mines or gas wells and associated infrastructure to maintain a given level of output.[4] Such expenditure is significant in resource industries because of the finite nature of natural resource deposits. It is typically less than capex for expansionary projects, because existing infrastructure and equipment from the depleted deposit is redeployed to the new mining area or gas field where possible. For example, haul trucks and ore processing facilities from depleted mines can be relocated to replacement sites in the iron ore or coal sectors, while replacement gas wells can be designed to connect to existing offshore pipelines and onshore LNG plants. Resource-replacement capex tends to occur infrequently; the timing and size of expenditure depends on the size of existing resource deposits, production (depletion) rates and market conditions.
- Asset-sustaining capex includes spending to repair, maintain or replace assets used for extraction and production (e.g. trucks, trains and LNG plants).[5] Unlike resource-replacement capex, asset-sustaining capex is more likely to be undertaken on an ongoing basis and is less dependent on changes in market conditions. However, a number of factors still influence the level and timing of asset-sustaining capex. A larger capital stock and higher equipment utilisation rates will increase the required amount of capex, consistent with spending to offset depreciation described in the production function approach. Asset-sustaining capex also tends to be higher in the middle years of an asset's life-span, because little spending should be required in the early years and firms generally try to minimise expenditure as an asset nears the end of its effective life. Technological and process improvements have reduced maintenance spending in recent years, which is expected to have resulted in a somewhat lower level of asset-sustaining capex than would otherwise have been the case.[6] There is generally limited ability to defer asset-sustaining capex.
Sustaining capex for Australia's three major resource commodities is expected to increase noticeably over the next five years, making a modest contribution to nominal GDP growth over that period (around 0.2 percentage points per annum; Graph 6). It is estimated that around $100 billion will be spent on sustaining capex for these commodities over the next five years. Even so, the amount in dollar terms is quite small compared to the boom. Total mining investment will be higher than estimates of sustaining capex due to investment in Australia's other resource commodities and any expansionary capex for coal, iron ore and LNG.
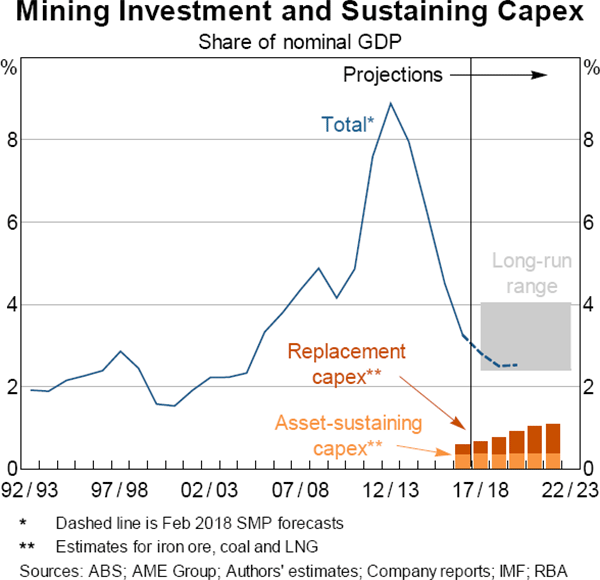
Around half of the estimated sustaining capex reflects spending by the LNG sector, as replacement gas fields are being considered at the two oldest Australian offshore LNG operations. These resource-replacement projects account for almost half of estimated LNG sustaining capex over the next five years because offshore LNG projects tend to involve the infrequent development of very large offshore gas fields with long production lives. Onshore coal seam gas (CSG) LNG projects, on the other hand, require the ongoing development of gas wells to maintain production volumes. Accordingly, resource-replacement capex for these projects is generally smaller and less volatile than for offshore projects.
In contrast, asset-sustaining capex by the LNG industry is expected to be relatively small and fairly stable on an annual basis for the next five years or so, partly reflecting that much of the existing capital stock was only purchased or built in the past few years.
Sustaining capex in the coal and iron ore sectors is expected to increase from a low level in coming years as assets age and replacement mine activity rises, particularly from around 2020. Estimates for the coal sector are somewhat more uncertain relative to other sectors, given the large number of mines in the coal sector and that extraction methods are relatively more heterogeneous than in other sectors.[7]
Resource-replacement capex by iron ore and coal producers is expected to be around $10 billion between 2018 and 2022. This largely reflects plans by major iron ore miners to build large replacement mines, with spending on front-end planning and engineering work for a number of these mines beginning in 2017. The majority of sustaining capex in the coal and iron ore sectors over the next few years is likely to be on asset-sustaining capex. Asset-sustaining capex in both the iron ore and coal sectors picked up in 2017, partly reflecting a catch-up in spending as revenues improved alongside higher prices for both commodities. This follows reportedly low levels of expenditure in 2015 and 2016, both as equipment purchased for expansionary investment during the mining boom was still relatively new and firms sought to reduce costs in light of lower coal and iron ore prices. This catch-up in spending is expected to provide a modest boost to mining sector capex over the next year or so. Asset-sustaining capex across the two commodities is expected to be similar in magnitude and increase gradually over coming years as assets reach a more mature stage of their life-cycle.
Conclusion
The mining sector's share of the capital stock has doubled since the early 2000s, driven by large-scale investment geared towards expanding the sector's productive capacity. Based on a set of simple assumptions, mining investment's share of GDP is likely to converge to between 2½ and 4 per cent in the long run, which is above the share that prevailed prior to the boom. Mining investment is expected to be relatively subdued over the next few years, because firms have limited appetite for further expansion. Instead, sustaining capex is likely to take on more importance as firms look to maintain their newly expanded productive capacity. Analysis based on company reports, the Bank's liaison program and information from other data providers suggests that sustaining capex for Australia's three major resource commodities will make a modest contribution to nominal GDP growth over the next five years, contributing around 0.2 percentage points per annum on average.
Appendix A: Sensitivity Analysis
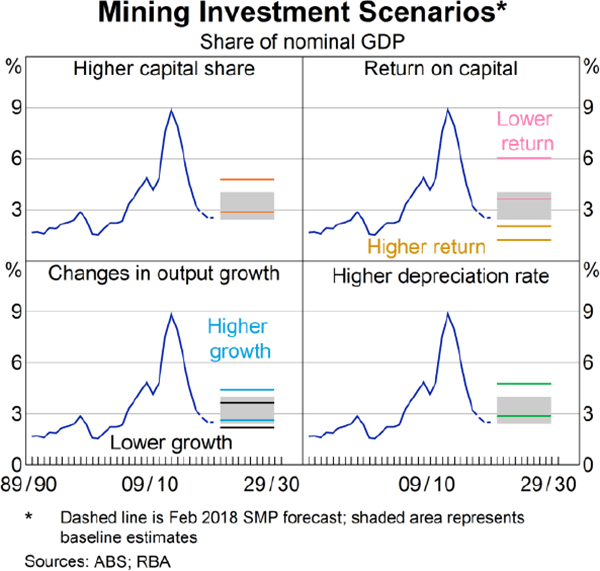
The estimate for the long-run mining investment share of GDP is sensitive to the values chosen for the key variables: the capital share of income, rate of return on capital, potential output growth and the depreciation rate. Given the substantial uncertainty around the values for each of these variables, we test the sensitivity of our results to plausible variations in their long-run values. Specifically, we check to see how the mining investment share of GDP changes under the following four scenarios, where all other variables are held constant:
- The capital share of mining income (assumed to be 76 per cent) increases to 90 per cent, based on LNG (which is more capital intensive than both iron ore and coal) making up a larger share of mining output than it has in the past.
- The rate of return on capital (assumed to be 15 per cent) falls to 10 per cent or increases to 30 per cent.
- The long-run growth rate of output (assumed to be 5 per cent) decreases to 4 per cent or increases to 6 per cent per annum.
- The depreciation rate (assumed to be 5.6 per cent) increases by 2 percentage points to 7.6 per cent.
A higher capital share and depreciation rate both lead to modest increases in our estimate of the long-run mining investment share of GDP, and changes to output growth only have a marginal impact on our results (Graph 7). However, variations in the return on capital have a substantial impact on our estimates of the long-run mining investment share. On balance, these scenarios provide some comfort around our initial conclusion that mining investment is unlikely to return to its peak, but should remain above its pre-boom level.
Footnotes
The authors are from Economic Analysis Department, and would like to thank Emily Poole, Daniel Rees, Jarkko Jääskelä and Michelle van der Merwe for their helpful comments and feedback. [*]
See Roberts, Saunders, Spence and Cassidy (2016) for a discussion of China's evolving demand for commodities. [1]
Generally speaking, the assumptions made by the ABS imply that the rate of depreciation on assets increases as the asset ages. [2]
These three sectors have accounted for the vast majority of total mining investment over the past 10 years, and averaged around 65 per cent of total resource exports. [3]
Associated infrastructure could include new gas pipelines and compression platforms for LNG projects and new conveyers, ore processing facilities, power and water infrastructure, and rail and road extensions for coal and iron ore projects. [4]
The classification of expenditure as capex rather than operating expenditure is determined largely by accounting standards. In general, expenditure on an asset that is expected to have an ‘enduring benefit’ (e.g. last a year or more) is classified as capex. [5]
Further technological and process improvements pose a structural downside risk to the future level of mining investment, particularly for sustaining investment. [6]
For example, coal can be extracted using a range of techniques applicable to open-cut or underground mines. In general, information from liaison suggests that asset-sustaining capex tends to be somewhat higher for underground mines. [7]
References
Lane K and T Rosewall (2015), ‘Firms' Investment Decisions and Interest Rates’, RBA Bulletin, June, pp 1–8.
Roberts I, T Saunders, G Spence and N Cassidy (2016), ‘China's Evolving Demand for Commodities’, in I Day and J Simon (eds), Structural Change in China: Implications for Australia and the World, Proceedings of a Conference, Reserve Bank of Australia, Sydney, pp 107–158.
Topp V, L Soames, D Parham and H Bloch (2008), ‘Productivity in the Mining Industry: Measurement and Interpretation’, Productivity Commission Staff Working Paper, December.


