RDP 2016-03: Why Do Companies Hold Cash? Appendix B: Corporate Cash and Asset Concentration
May 2016 – ISSN 1448-5109 (Online)
- Download the Paper 1.07MB
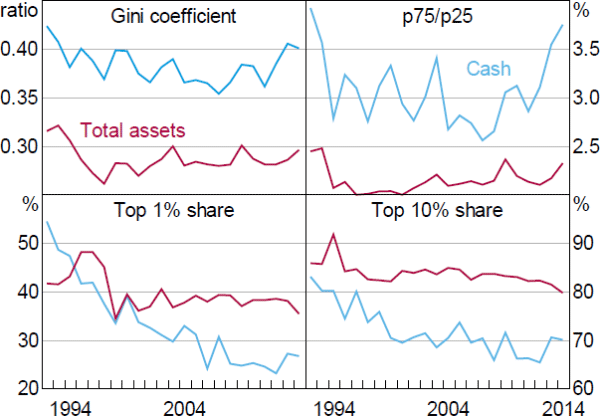
This appendix explores the concentration of corporate cash and total asset holdings in Australia (Figure B1). We consider a range of different indicators of concentration (or ‘inequality’) in cash holdings.

Note: Log levels of real cash holdings and real total assets are used
Sources: Authors' calculations; Morningstar
Our findings indicate that some of the high concentration of cash simply reflects the fact that the distribution of company size is highly skewed, with a few large companies and many small companies; that is, not only is cash very concentrated, but all other types of assets too. For example, the share of cash held by the top 1 per cent of companies by assets is quite similar to the share of assets held by the same top 1 per cent (although the Gini coefficient and the ratio of the 75th percentile to 25th percentile suggest that cash is more unevenly distributed across companies than total assets).
More importantly, all the indicators show that the concentration of cash holdings has declined over time. Indeed, unlike the situation in the United States, where as of year-end 2013, the largest 1 per cent held 36 per cent of total cash, up 9 percentage points over the last five years, we find that the largest 1 per cent of Australian companies have been holding a decreasing share of cash (and total assets). In 2004, for example, the largest 1 per cent of companies held 33 per cent of cash, whereas the latest estimates show they now hold 27 per cent. This suggests that the secular rise in cash is not due to just the behaviour of the largest companies in Australia.